Umbel Campaigns & Engagements Overviews
WHAT IS UMBEL?
Umbel is a platform created to help marketers in the sports, media, and entertainment industries grow their fanbase, target their fans, provide them with better in-venue experiences, and sell more tickets. Umbel achieved this by allowing marketers to import all of their fan data from disparate systems and consolidate that data down to the single fan level providing a rich profile about each fan.
In the product, marketers could view how segments differed or compared to their audience as a whole to find cohorts of people to market to on Facebook, email or other social networks and then view any Facebook campaign results in the app. Umbel also helped marketers acquire new fan data via our hosted “Activations” we called Activators (later referred to as “Engagements”). These were micro-sites we hosted for our clients usually consisting of enter-to-win contests or giveaways our users could launch in just a few minutes with a goal of collecting a users information for the chance to win or receive a prize.
PROJECT BACKGROUND
This project came about when we attempted to envision what an Umbel dashboard could be via a GV Design Sprint. After I began to work through what an MVP dashboard could be based on the testing during the Design Sprint, it became apparent that there were some core product enhancements that would need to take place before we even began to consider a project like a dashboard. You can read more on that exercise we conducted here.
We would need to improve two core offerings of the Umbel platform: the media campaigns and Umbel hosted Engagement pages. The problem with these pages is that they only displayed data for individual campaigns and engagements, but didn’t provide a way to see aggregates of that data over a period of time. This made determining whether the social media campaigns we ran for our clients or their fan data acquisitions were a success or a failure.
GOALS
Primary
- Determine the most important metrics used to evaluate the success of each of these offering to highlight. It would be useful to lean on the summary reports our Client Service and Media Campaign Teams created after each campaign or engagement as well as chat with clients to get their expectations.
- Add a time component to filter the results. We knew they often looked at one or more campaigns or engagements over a period of time to compare to previous campaigns or engagements.
Secondary
- Determine if we need to change any metrics displayed on the individual campaign or engagement level. This would further aid in evaluation of these pieces of the app.
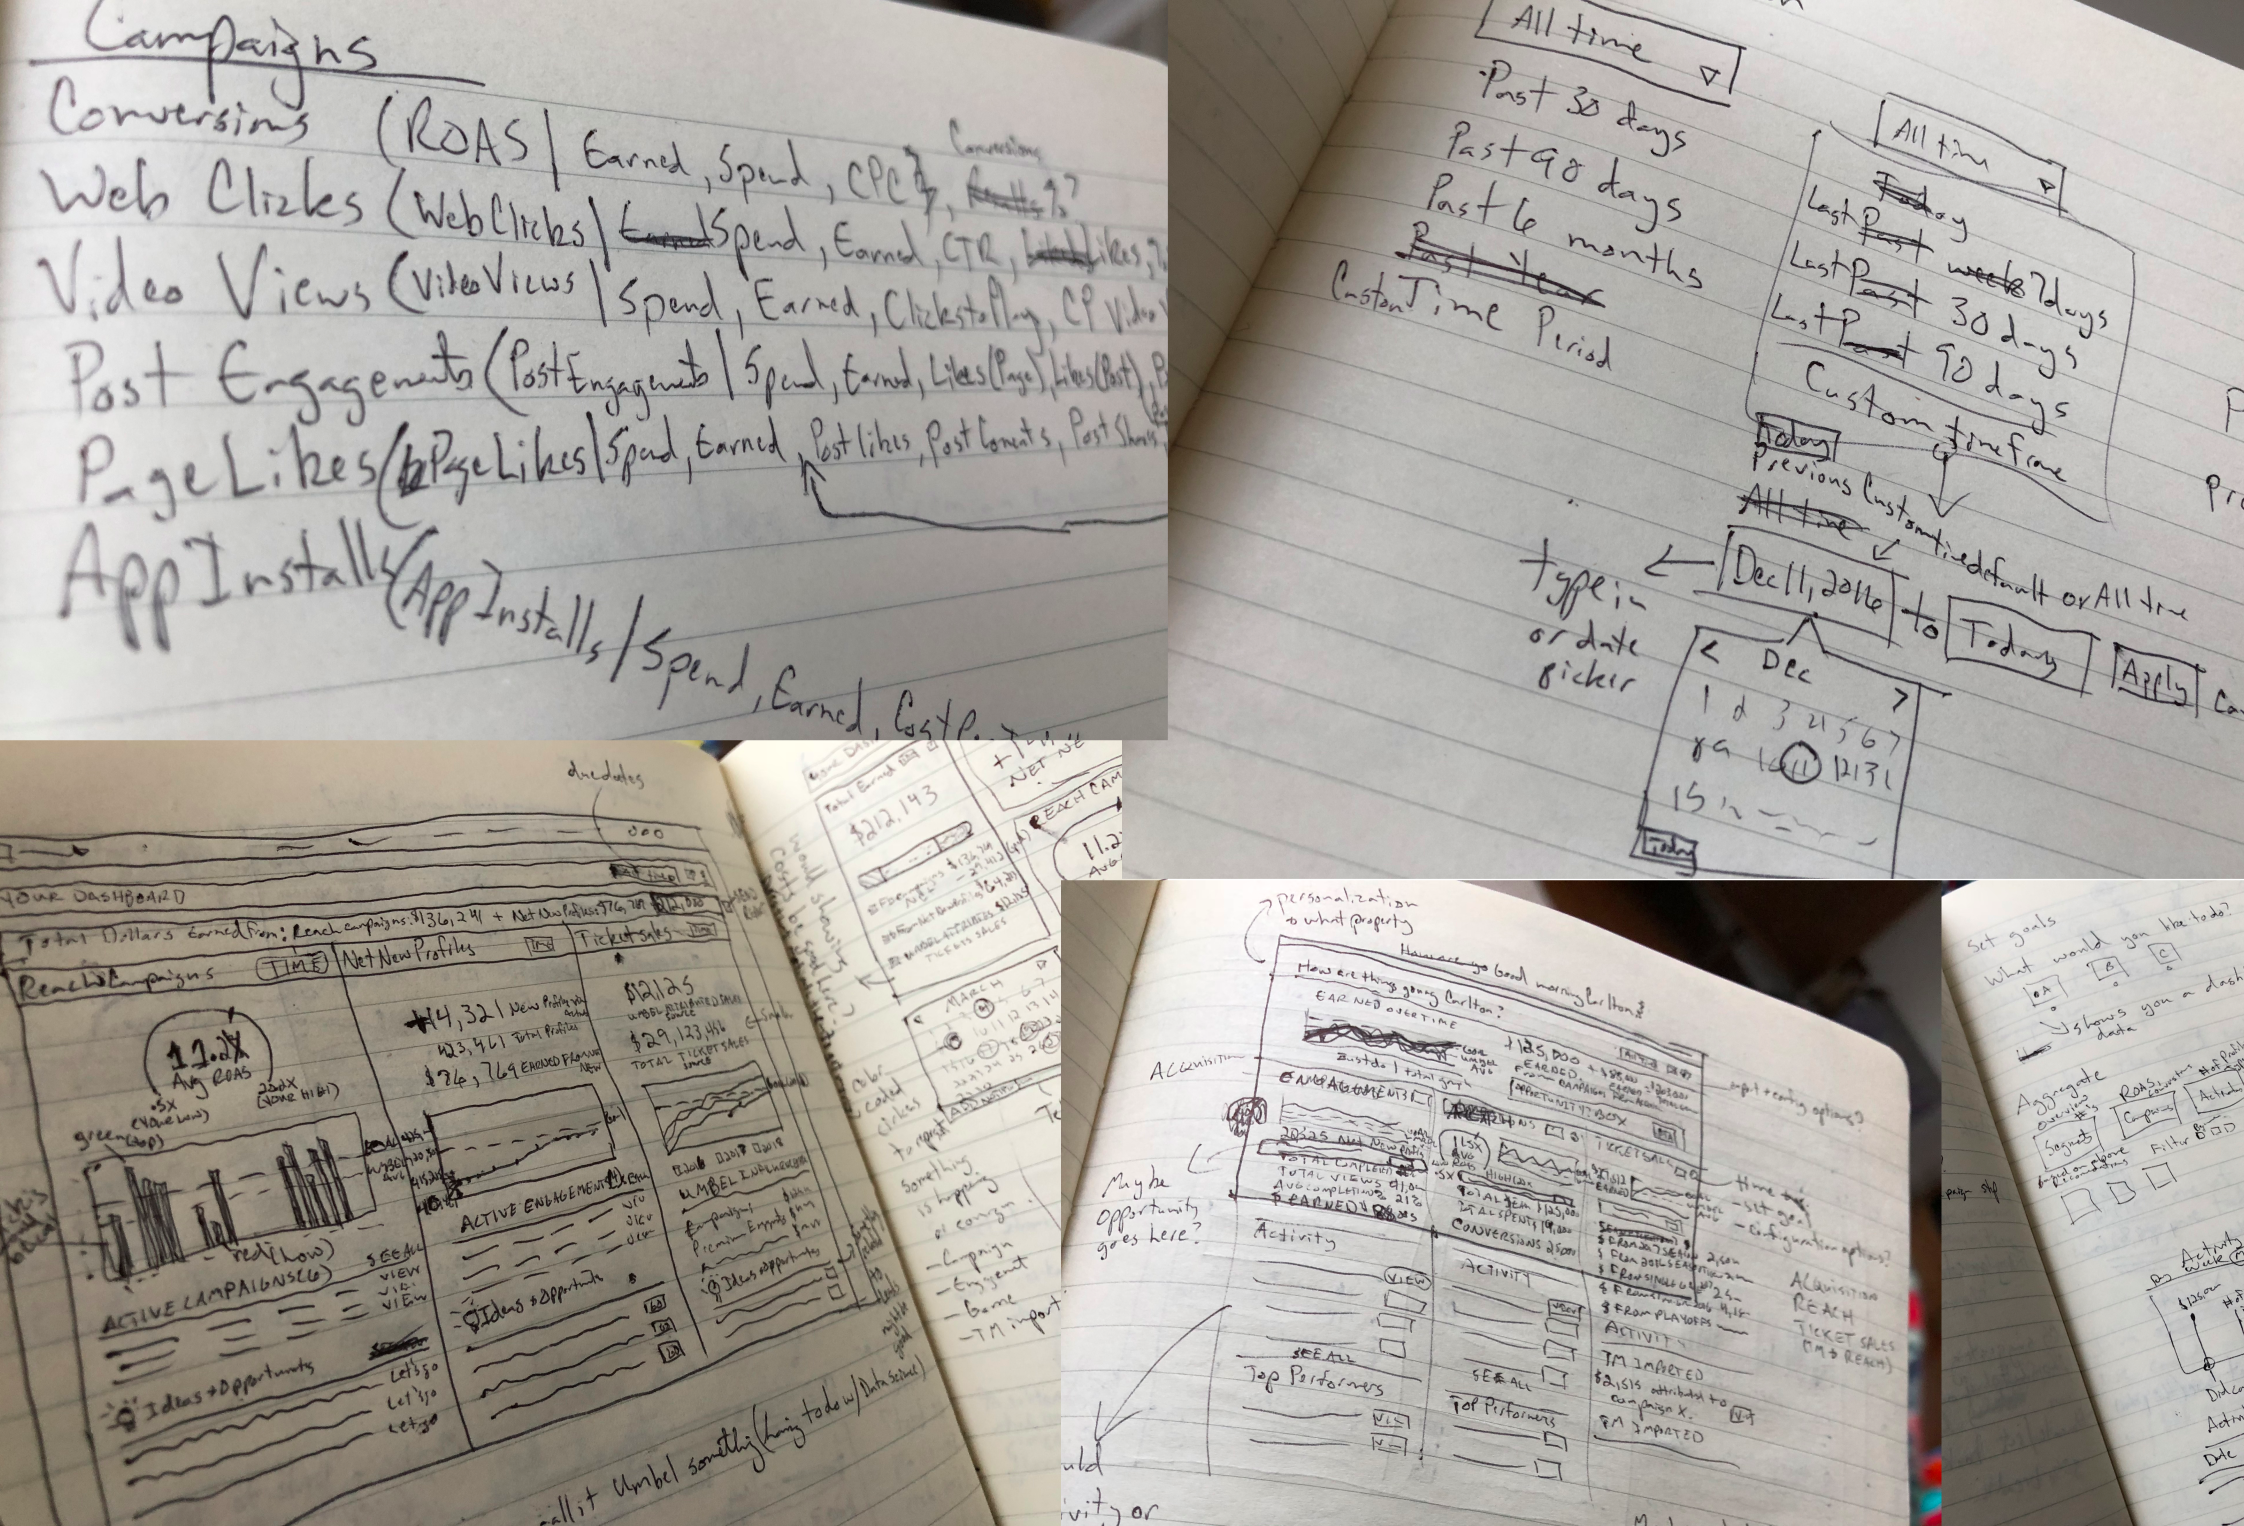
PROCESS
Using specific feedback from users during the Design Sprint user testing we conducted a few weeks prior, I would start by compiling the aggregate metrics we would show for each campaign/engagement type when it is filtered, as well as the metrics we would show in the rows and columns for the single campaign/engagements. I would need to work internally with our Media Campaigns Team and Client Services Team to determine key campaign and engagement metrics to surface based on reports they would send to clients.
I would need to quickly ideate on what the next versions of these overview sections could be make sure that this current solution would allow for further iteration that wouldn’t require a complete reconfiguration of this section. Then I would need to get some clients eyes on these to make sure we are meeting their expectations and seeing if there are any metrics we are missing.
DESIGN PRIORITIES
- The primary evaluation metric should be the most prominent and add only the other critical metrics for evaluating success in an overview area. Do this for each campaign and engagement type. ROI is often that metric, though it does change based on whether it is a campaign or engagement. Each type of campaign and engagement would need to be evaluated. Work with Client Services to determine the most important metrics they feel we should show for the aggregate and type of campaign or engagement views based on what they show their clients in their monthly/yearly reports.
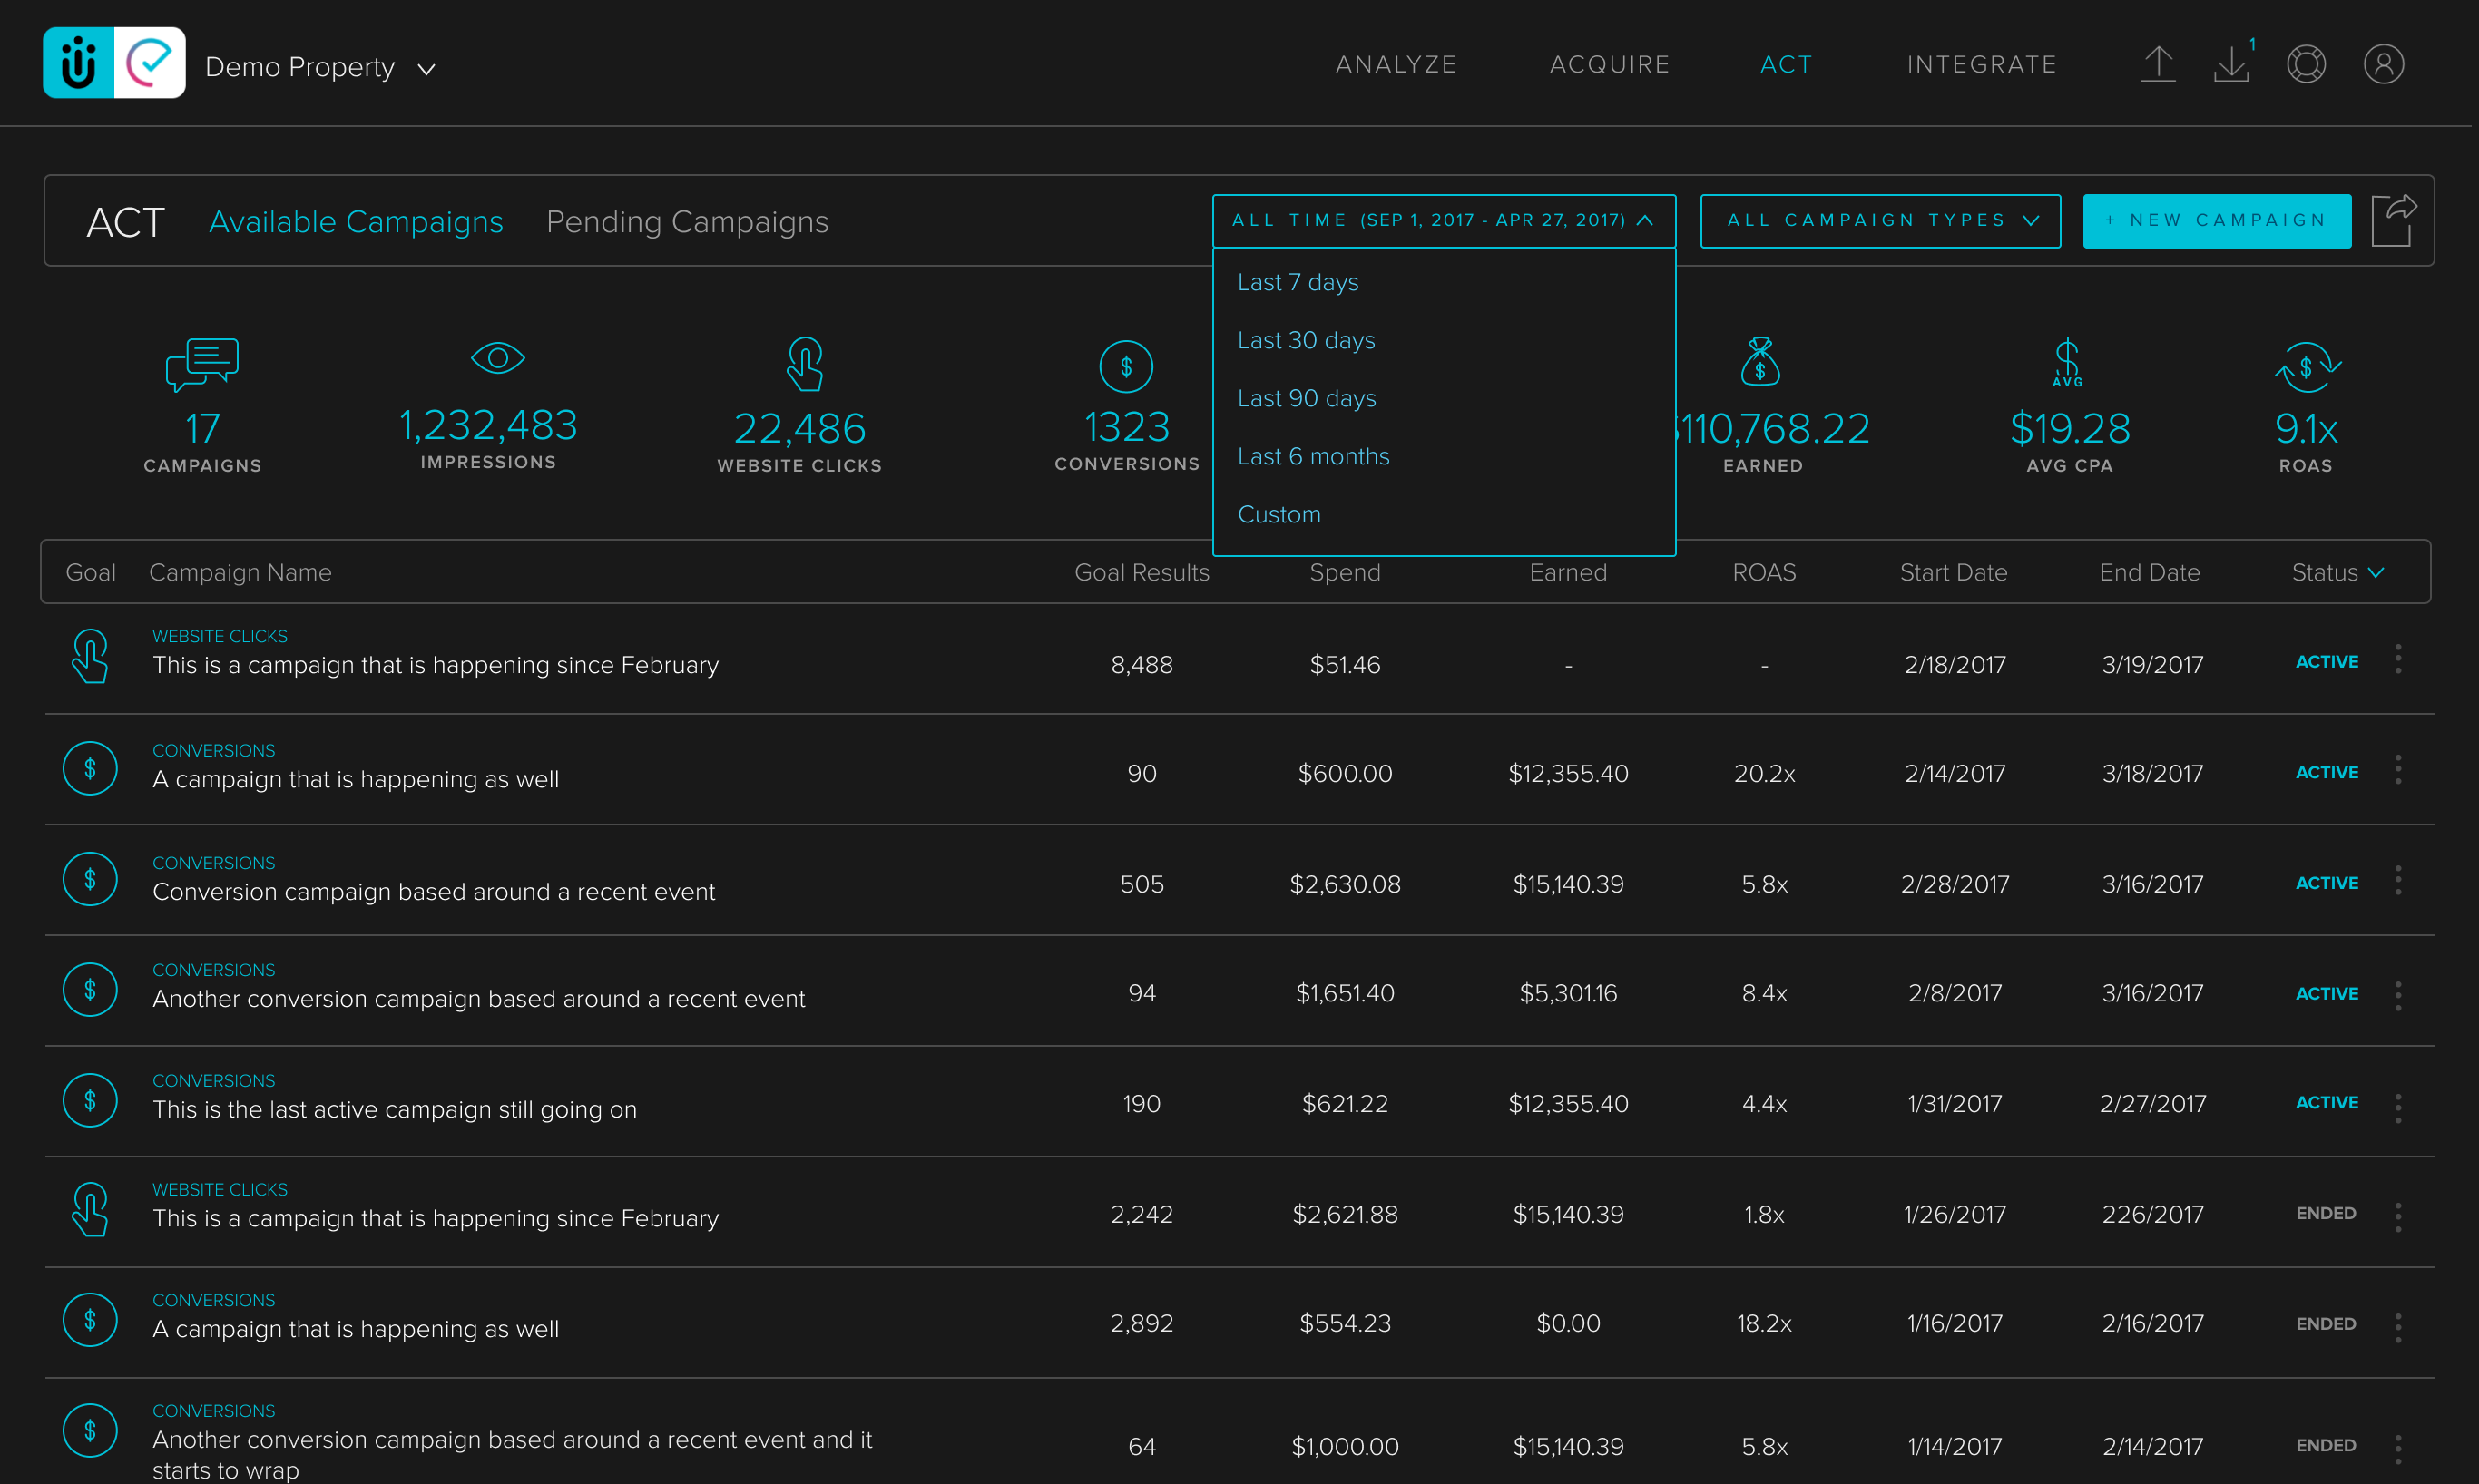
- Add time and campaign/engagement types as filters. This will allow for easy manipulation of the data.
- Standardize the data displayed in the “all view”. Knowing the data we want to display is different based on the campaign type or engagement type they are looking at we will need to figure out what those overarching metrics might be and how it might change when a campaign or engagement is filtered by type.
- Make sure both the Campaigns and Engagements pages remain similar in layout. In order to retain UX patterns already in place, we wanted to make sure our solution could work for both pages to keep the usability patterns the same and retain consistency.
- Evaluate whether we will need to change any metrics or funnels displayed on the individual level. Determine what needs to get changed to each individual campaign or engagement to make sure the primary data is displayed for each and is consistent with our new more focused metrics.
- Evaluate export data accuracy. Make sure the CSV export of the data is displaying the correct values for each type of campaign or engagement as well as something that is exported as an aggregate data set.
- Showing a time series graph of some sort would be nice. Keep in mind we would eventually want to make something more visual later to see trends or performance over time.
SOLUTION
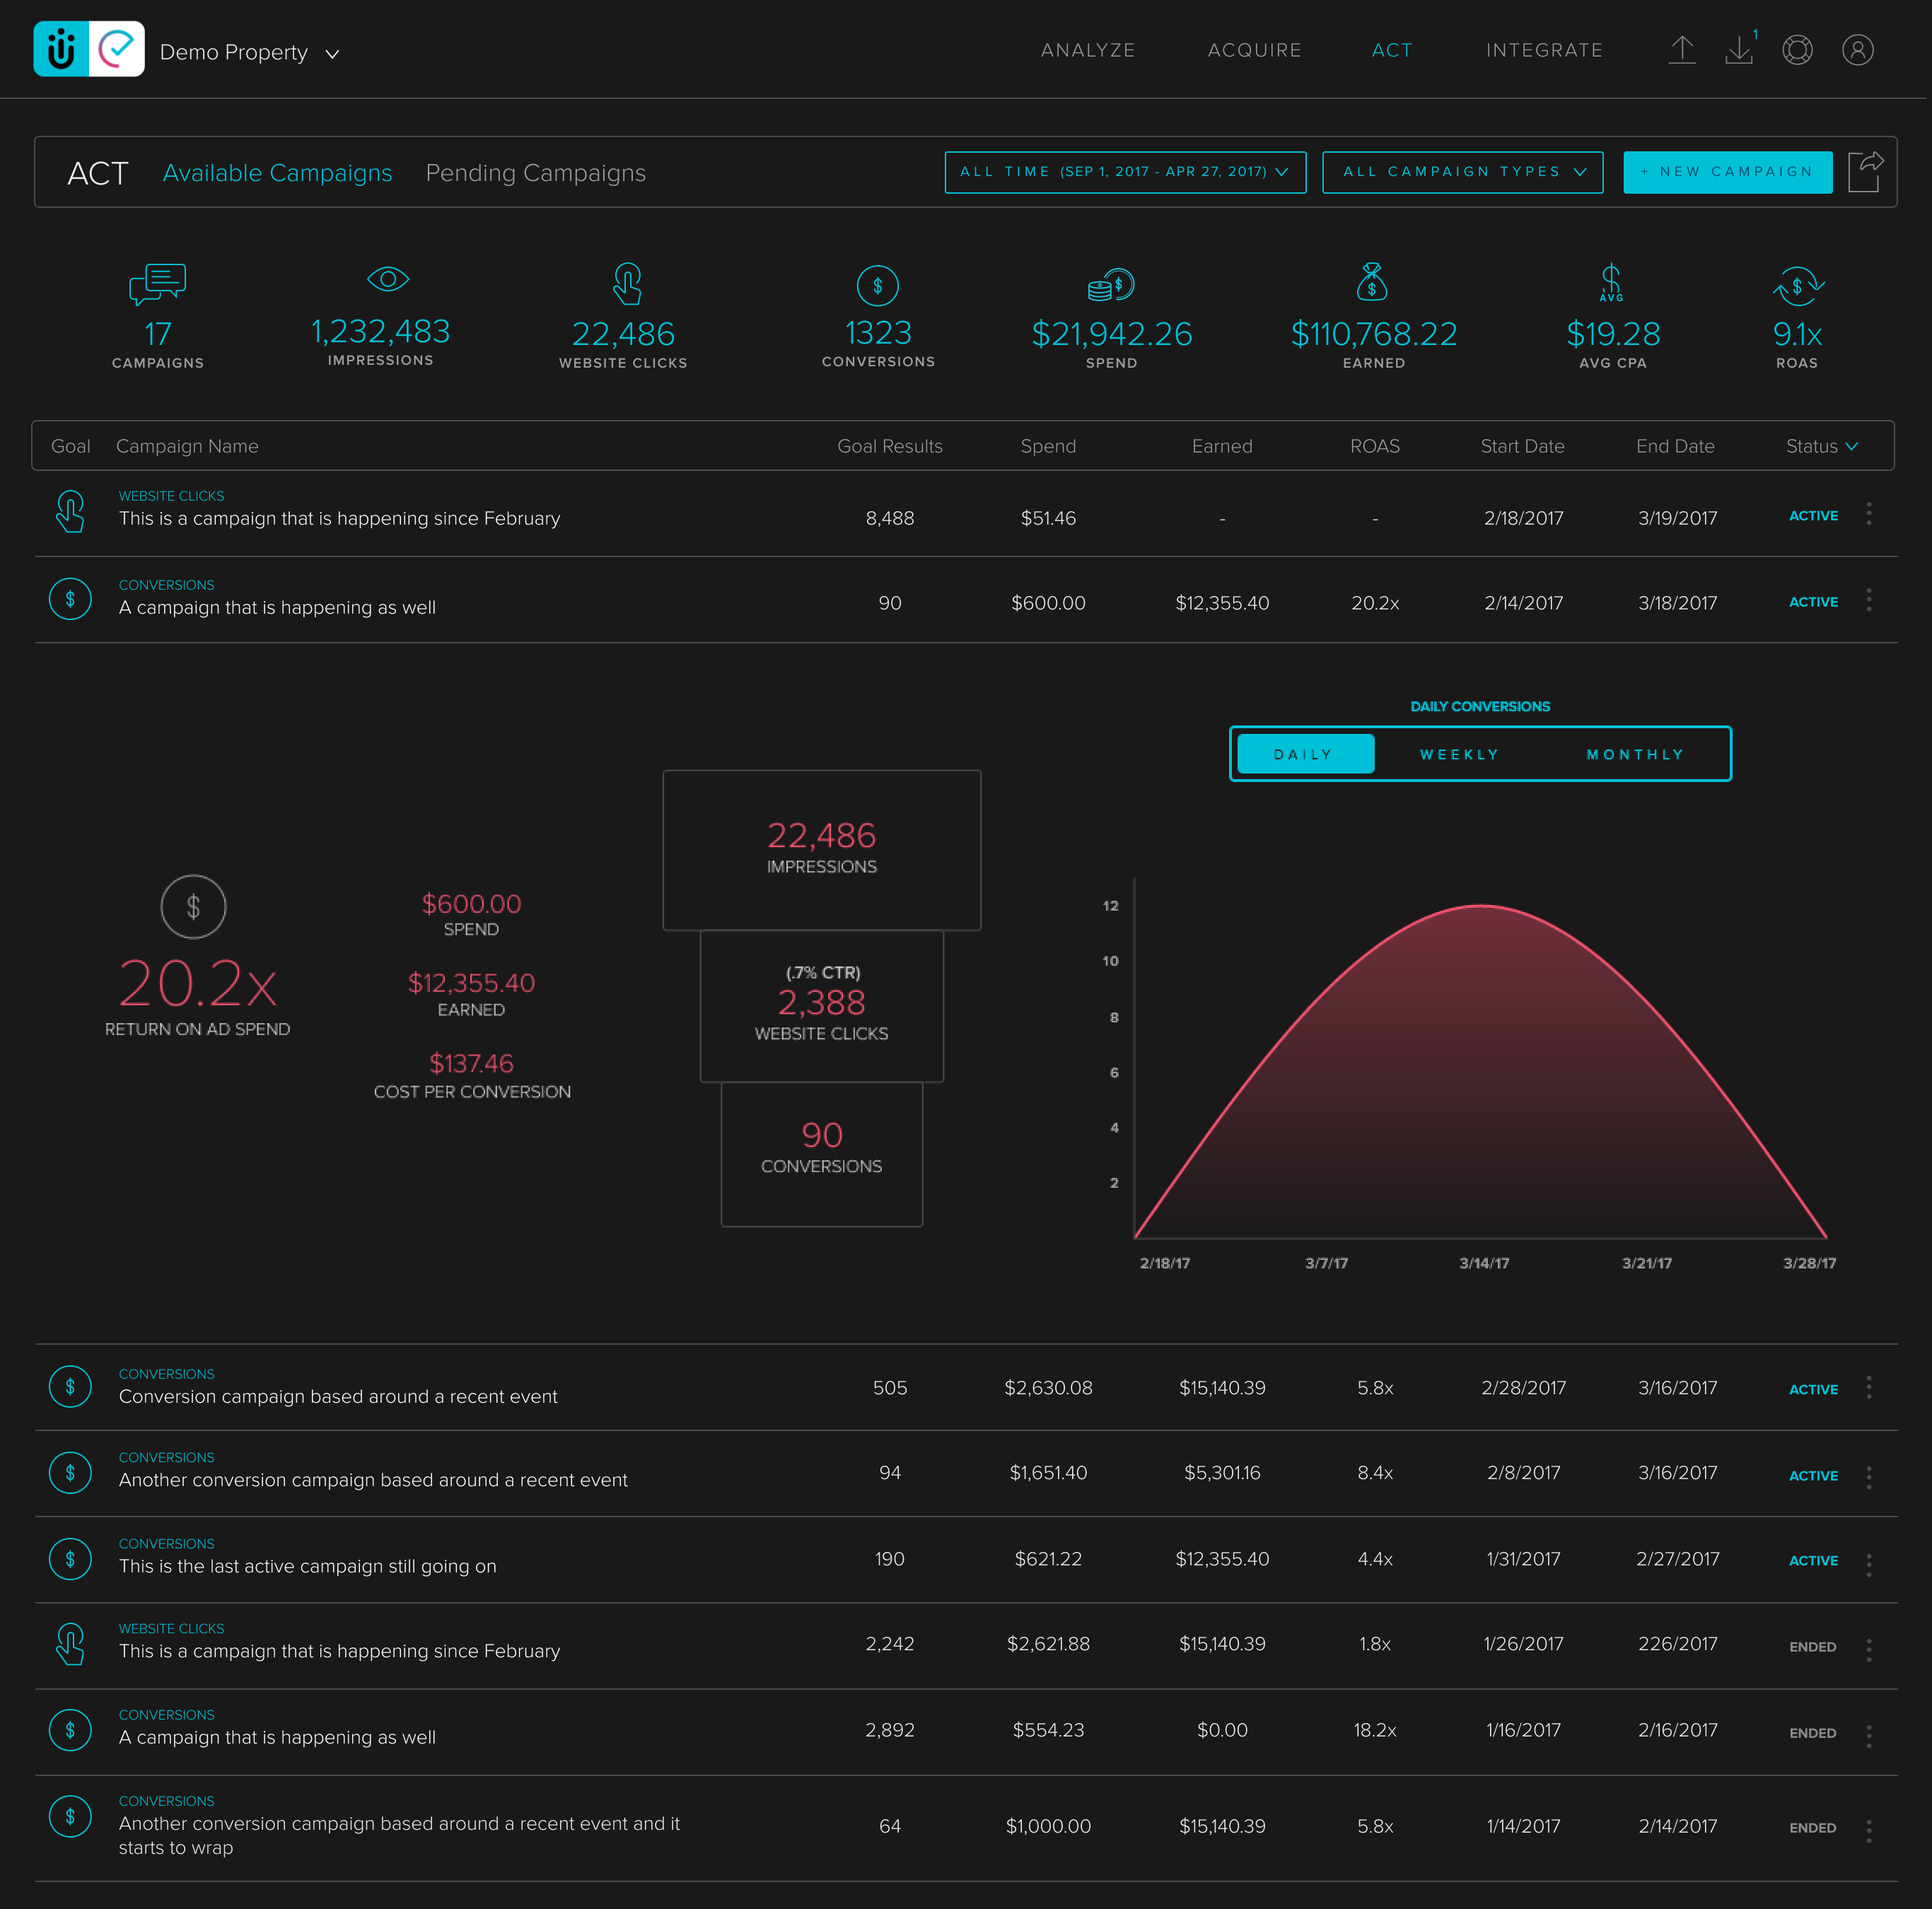
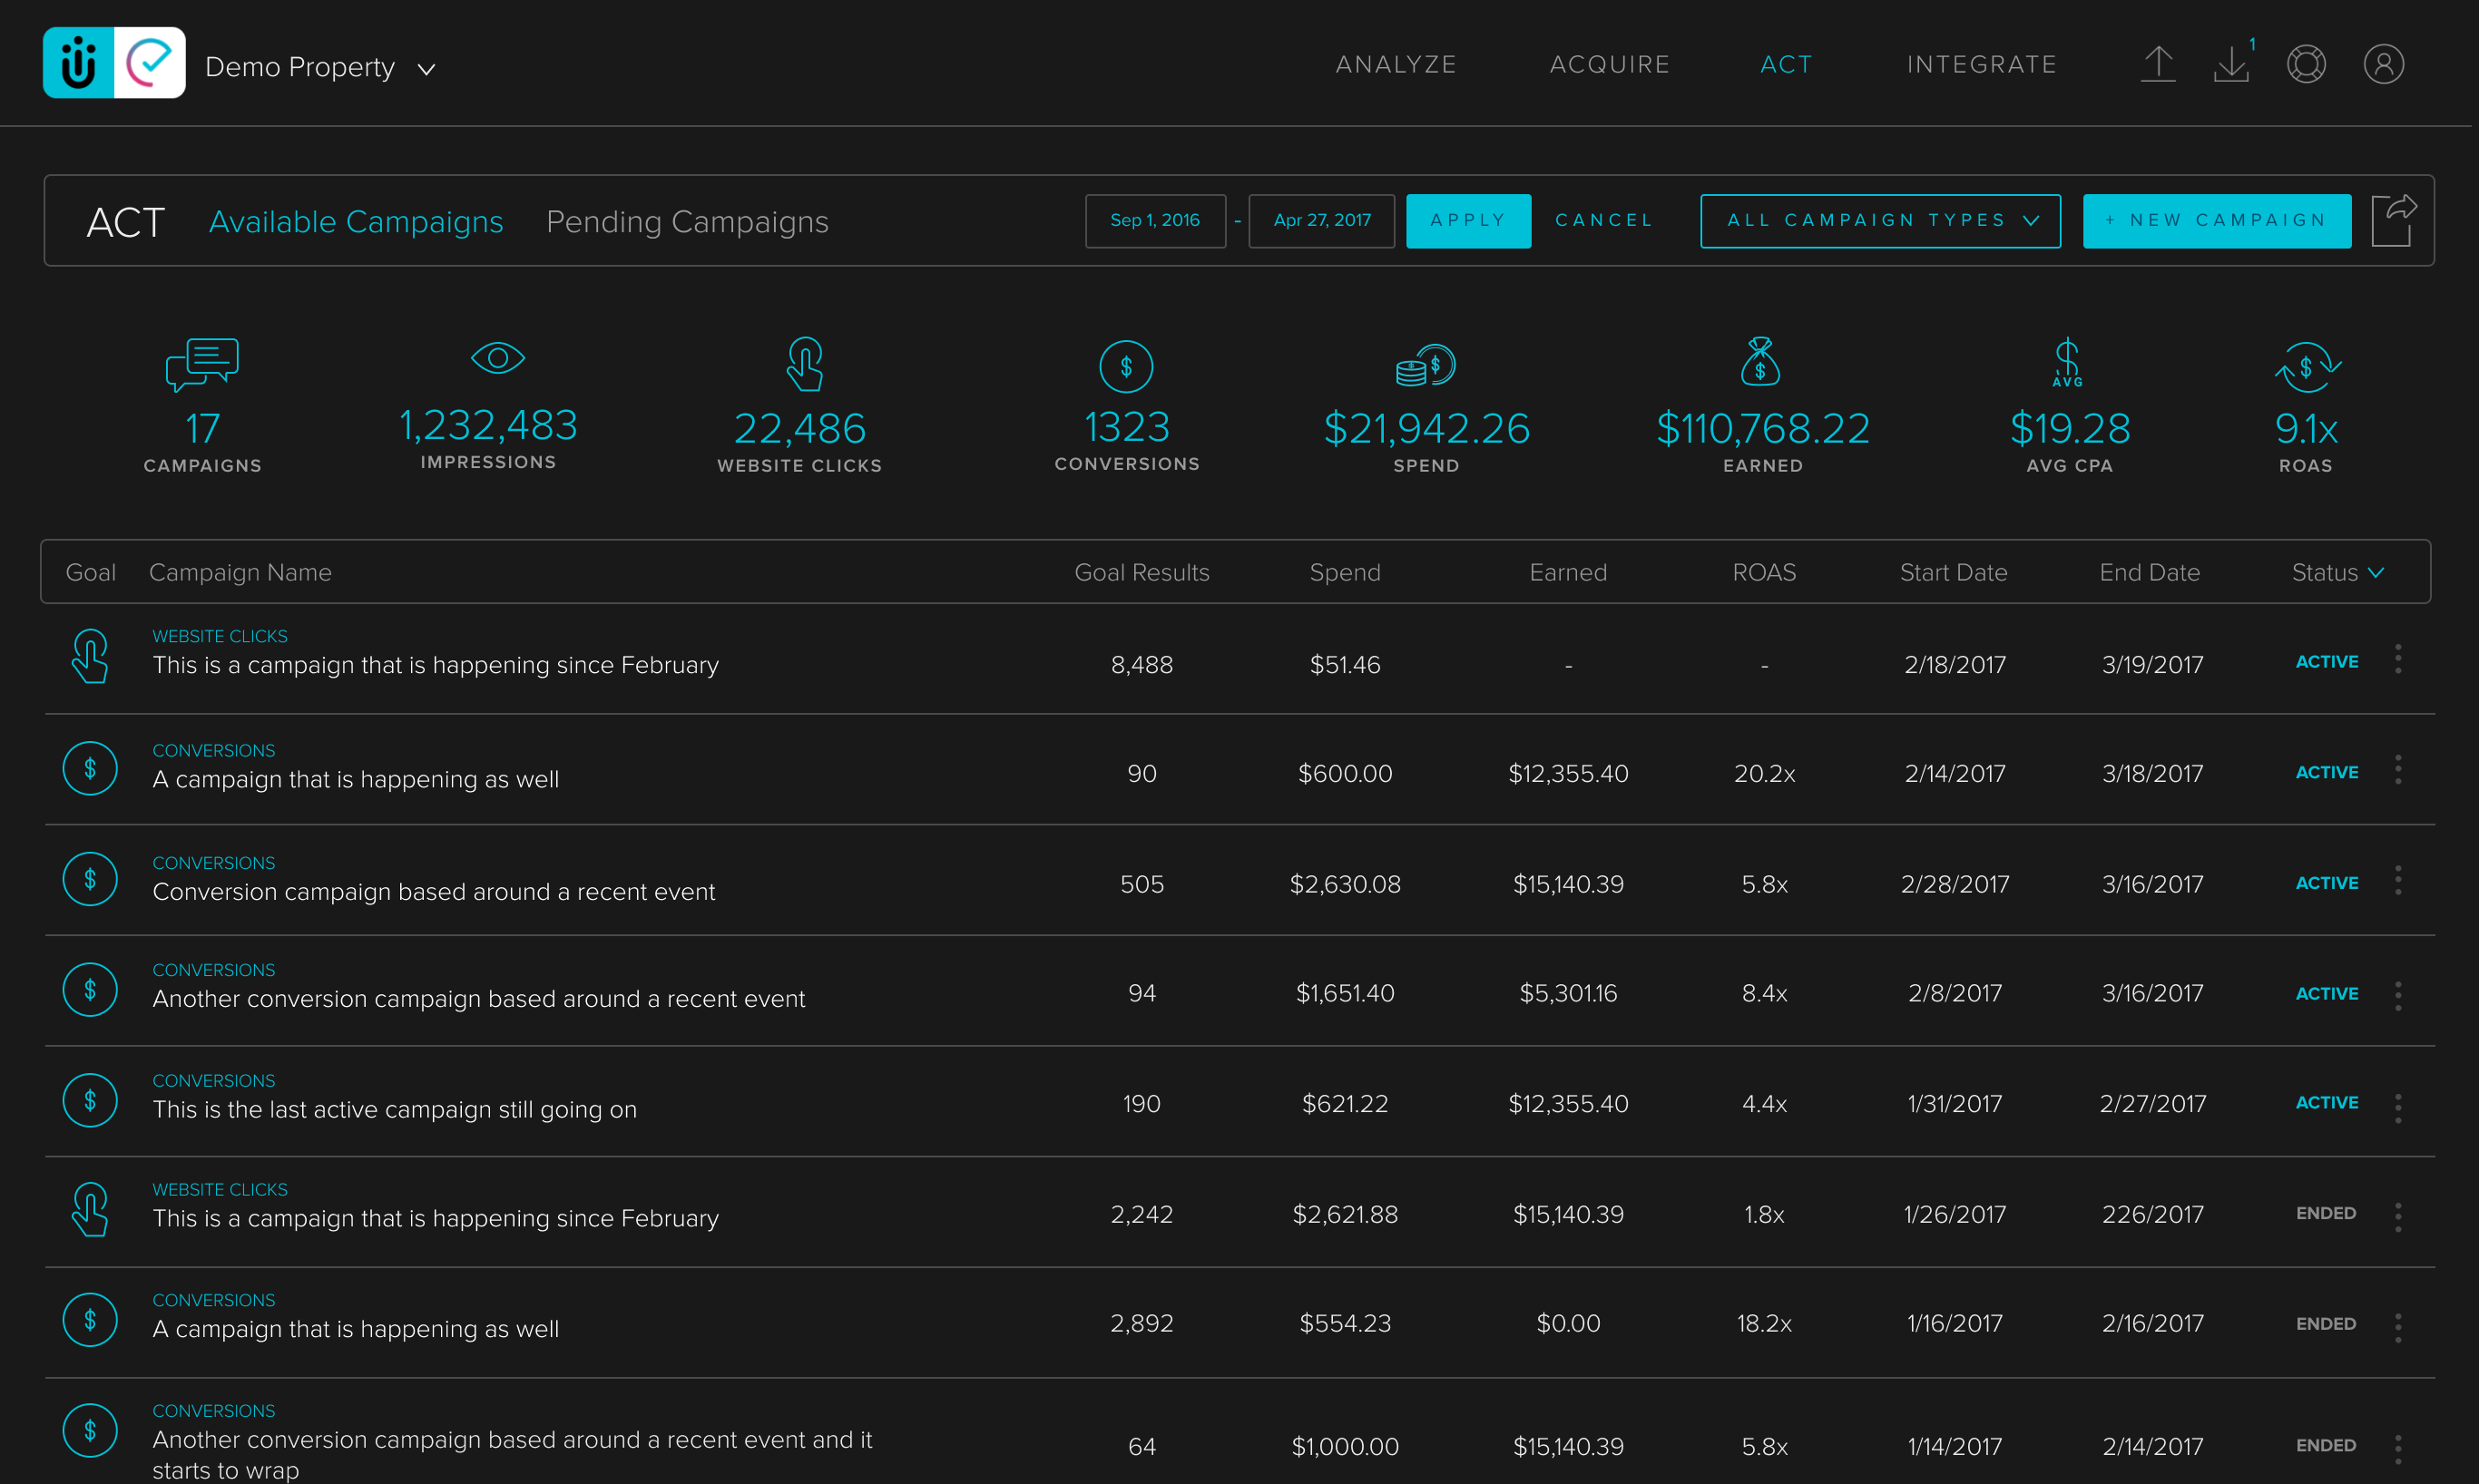
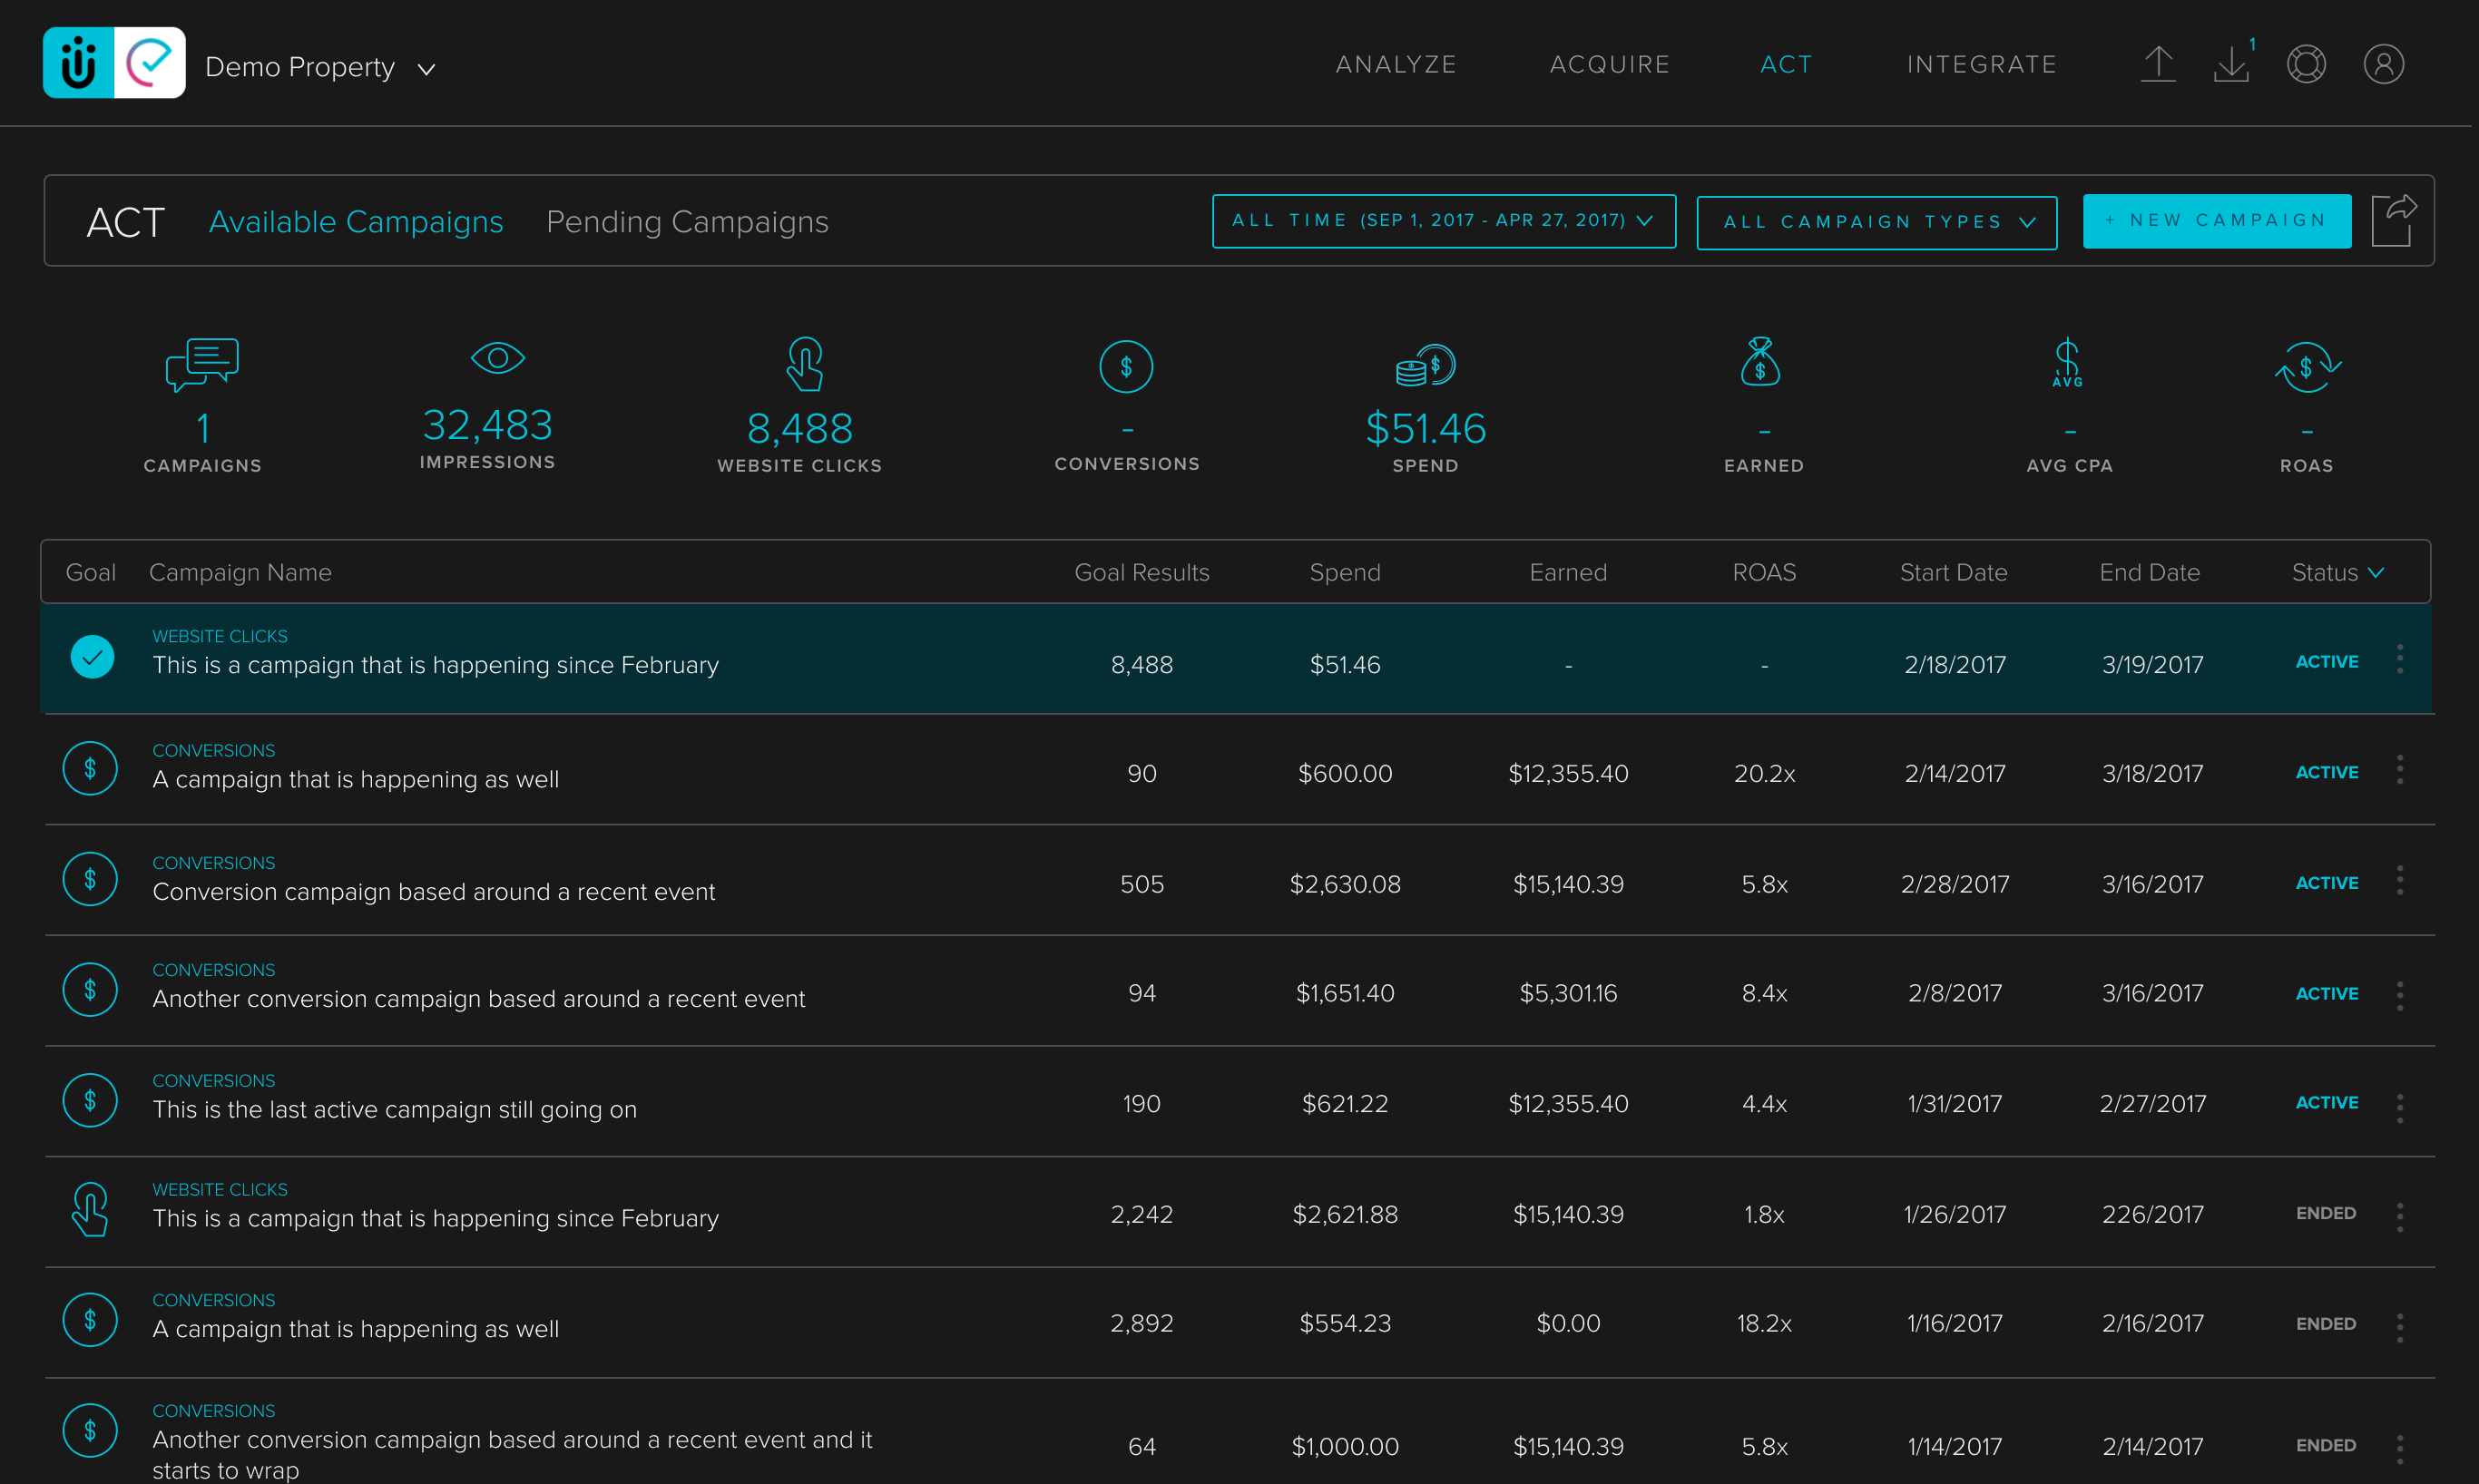
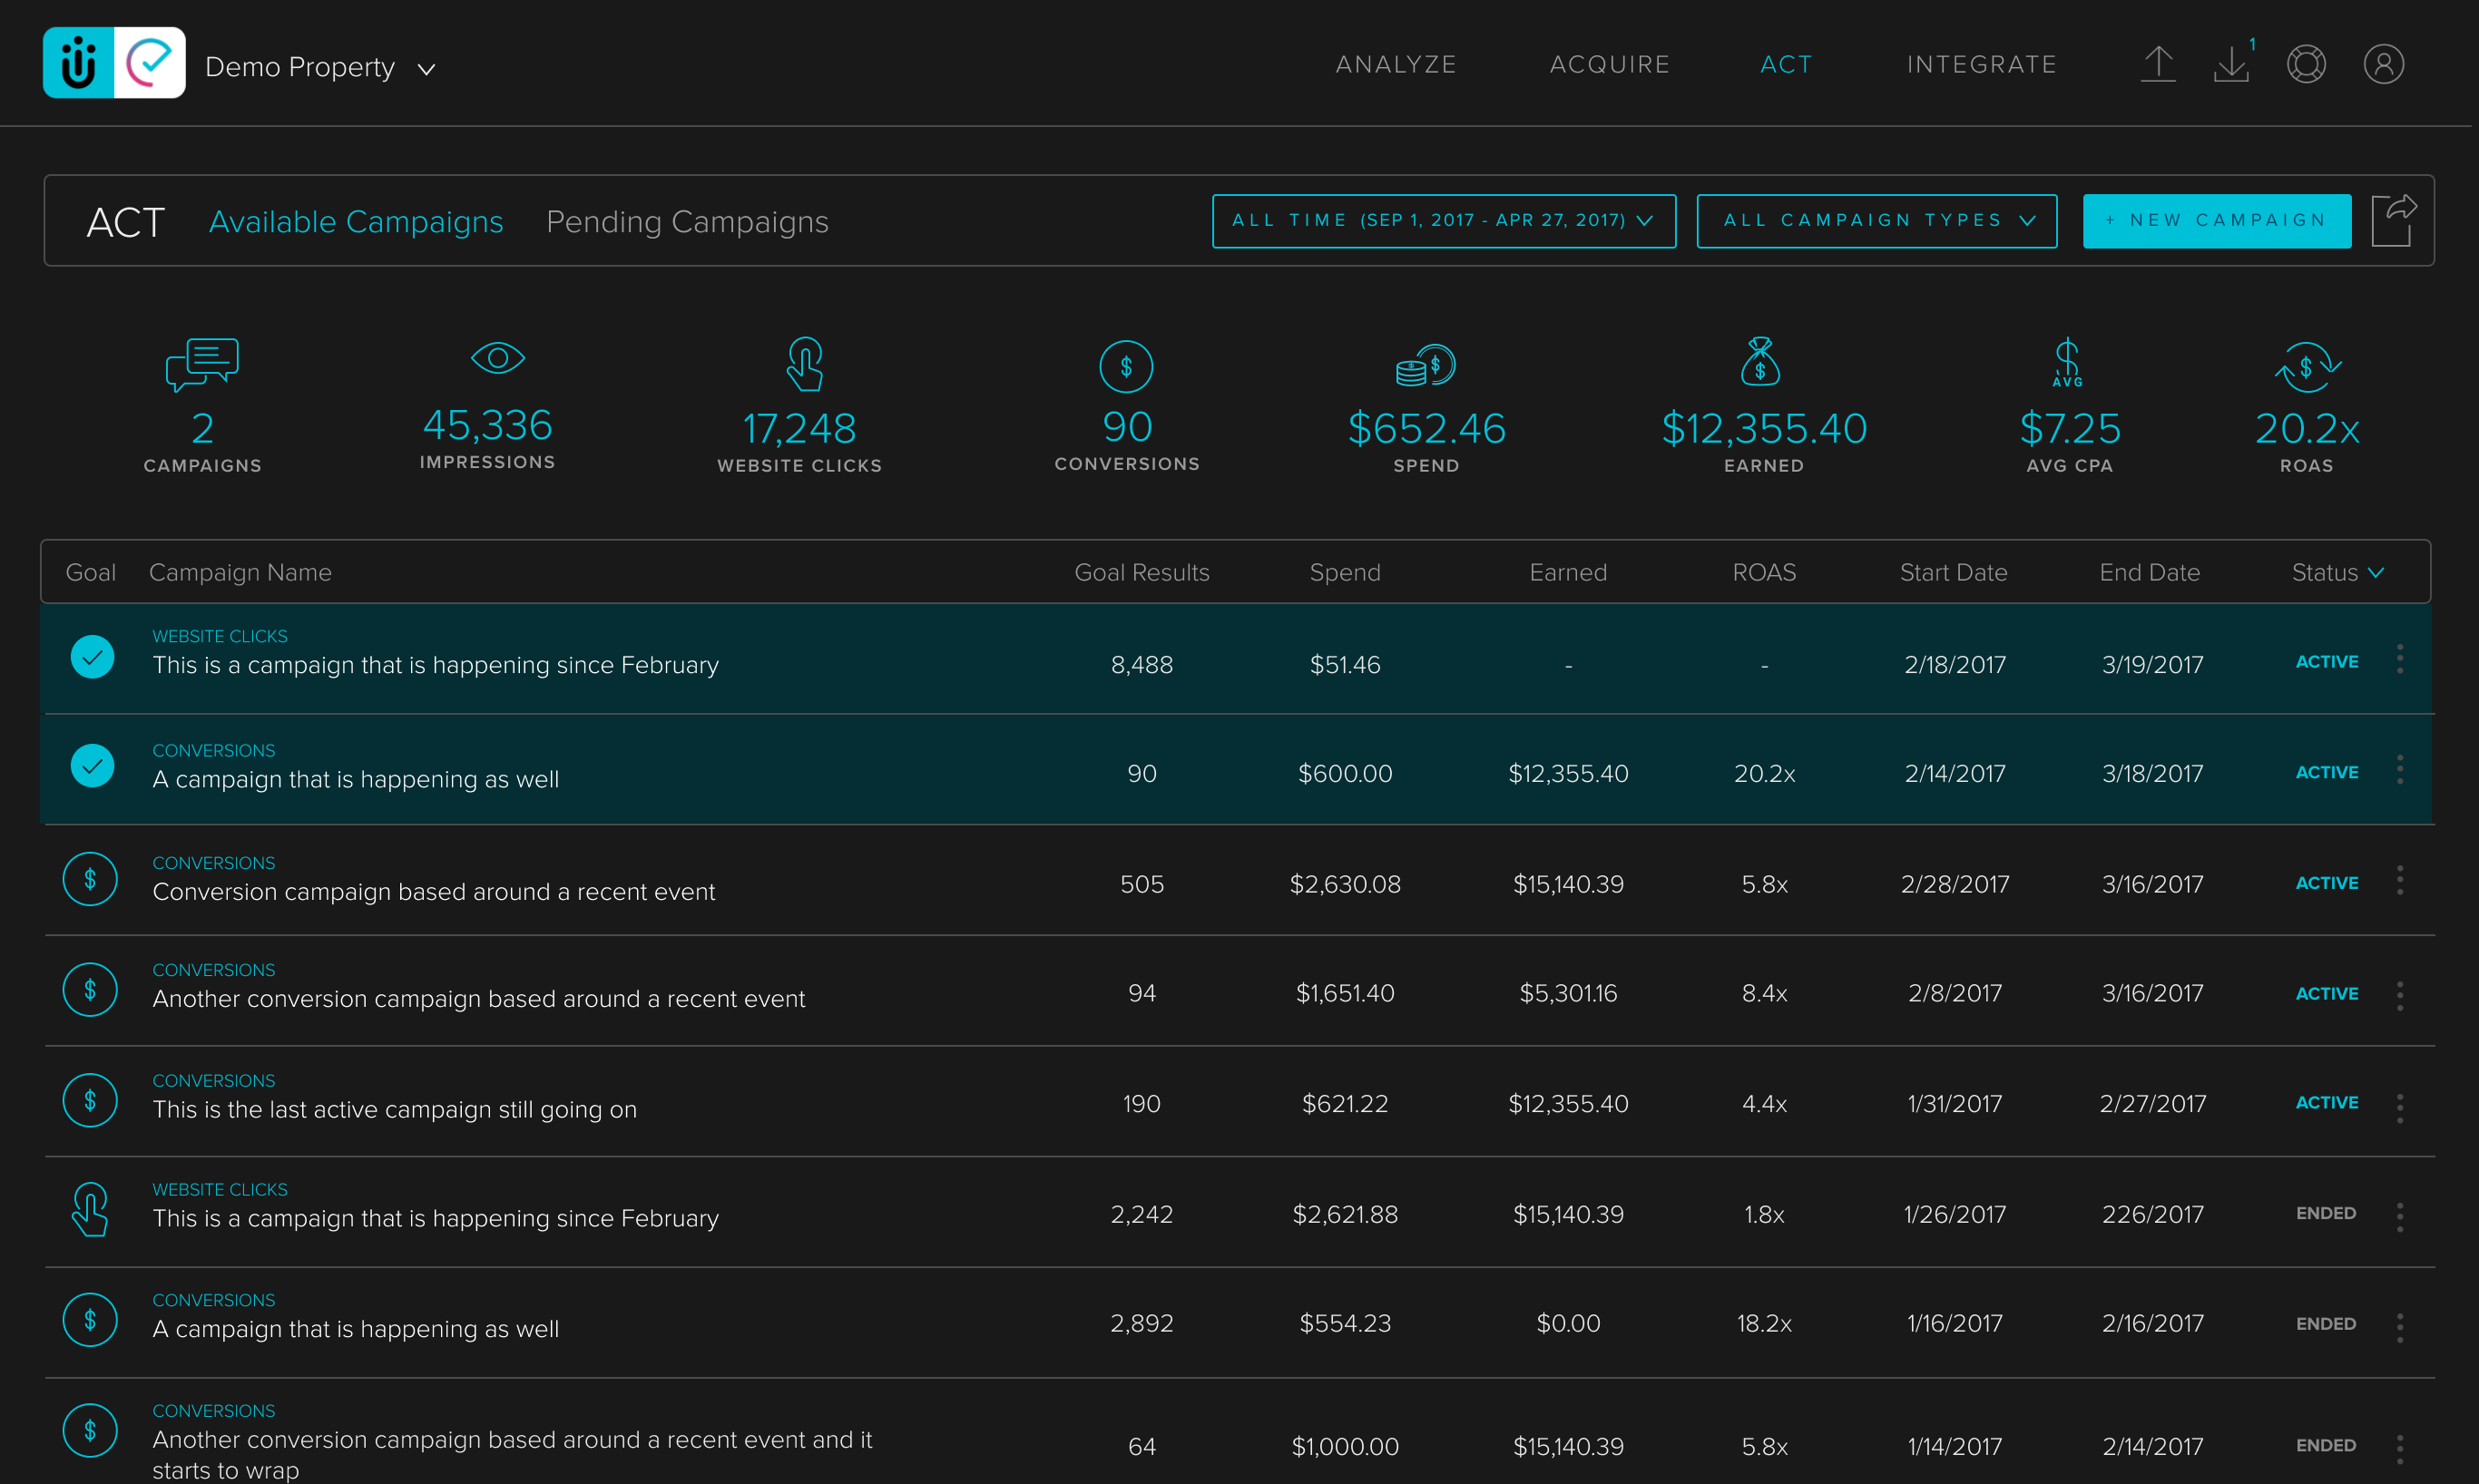
We decided the first step to making an eventual dashboard should be to aggregate metrics for our campaigns and engagements by creating sections at the top of each page to show aggregate data. Adding time filtering, campaign/engagement type filtering, and a multi-select option for each single campaign/engagement could allow our clients to see aggregates in any way they might need.
The data we show would be updated based on the campaign/engagement type filter in order to show more value and metrics that are specific to evaluating the success or failure of those specific types of campaigns/engagements. Finally, we updated the expanded view of these sections in order to reflect the new main evaluation metric for that type of media or engagement campaign.
MY ROLE
- Feature discovery via user studies from the Design Sprint we conducted.
- User Interviews internally and with our users to determine what metrics were most beneficial.
- Digital prototype review with users
- UI/UX design
- Requirement documentation/tickets for development
RESULTS
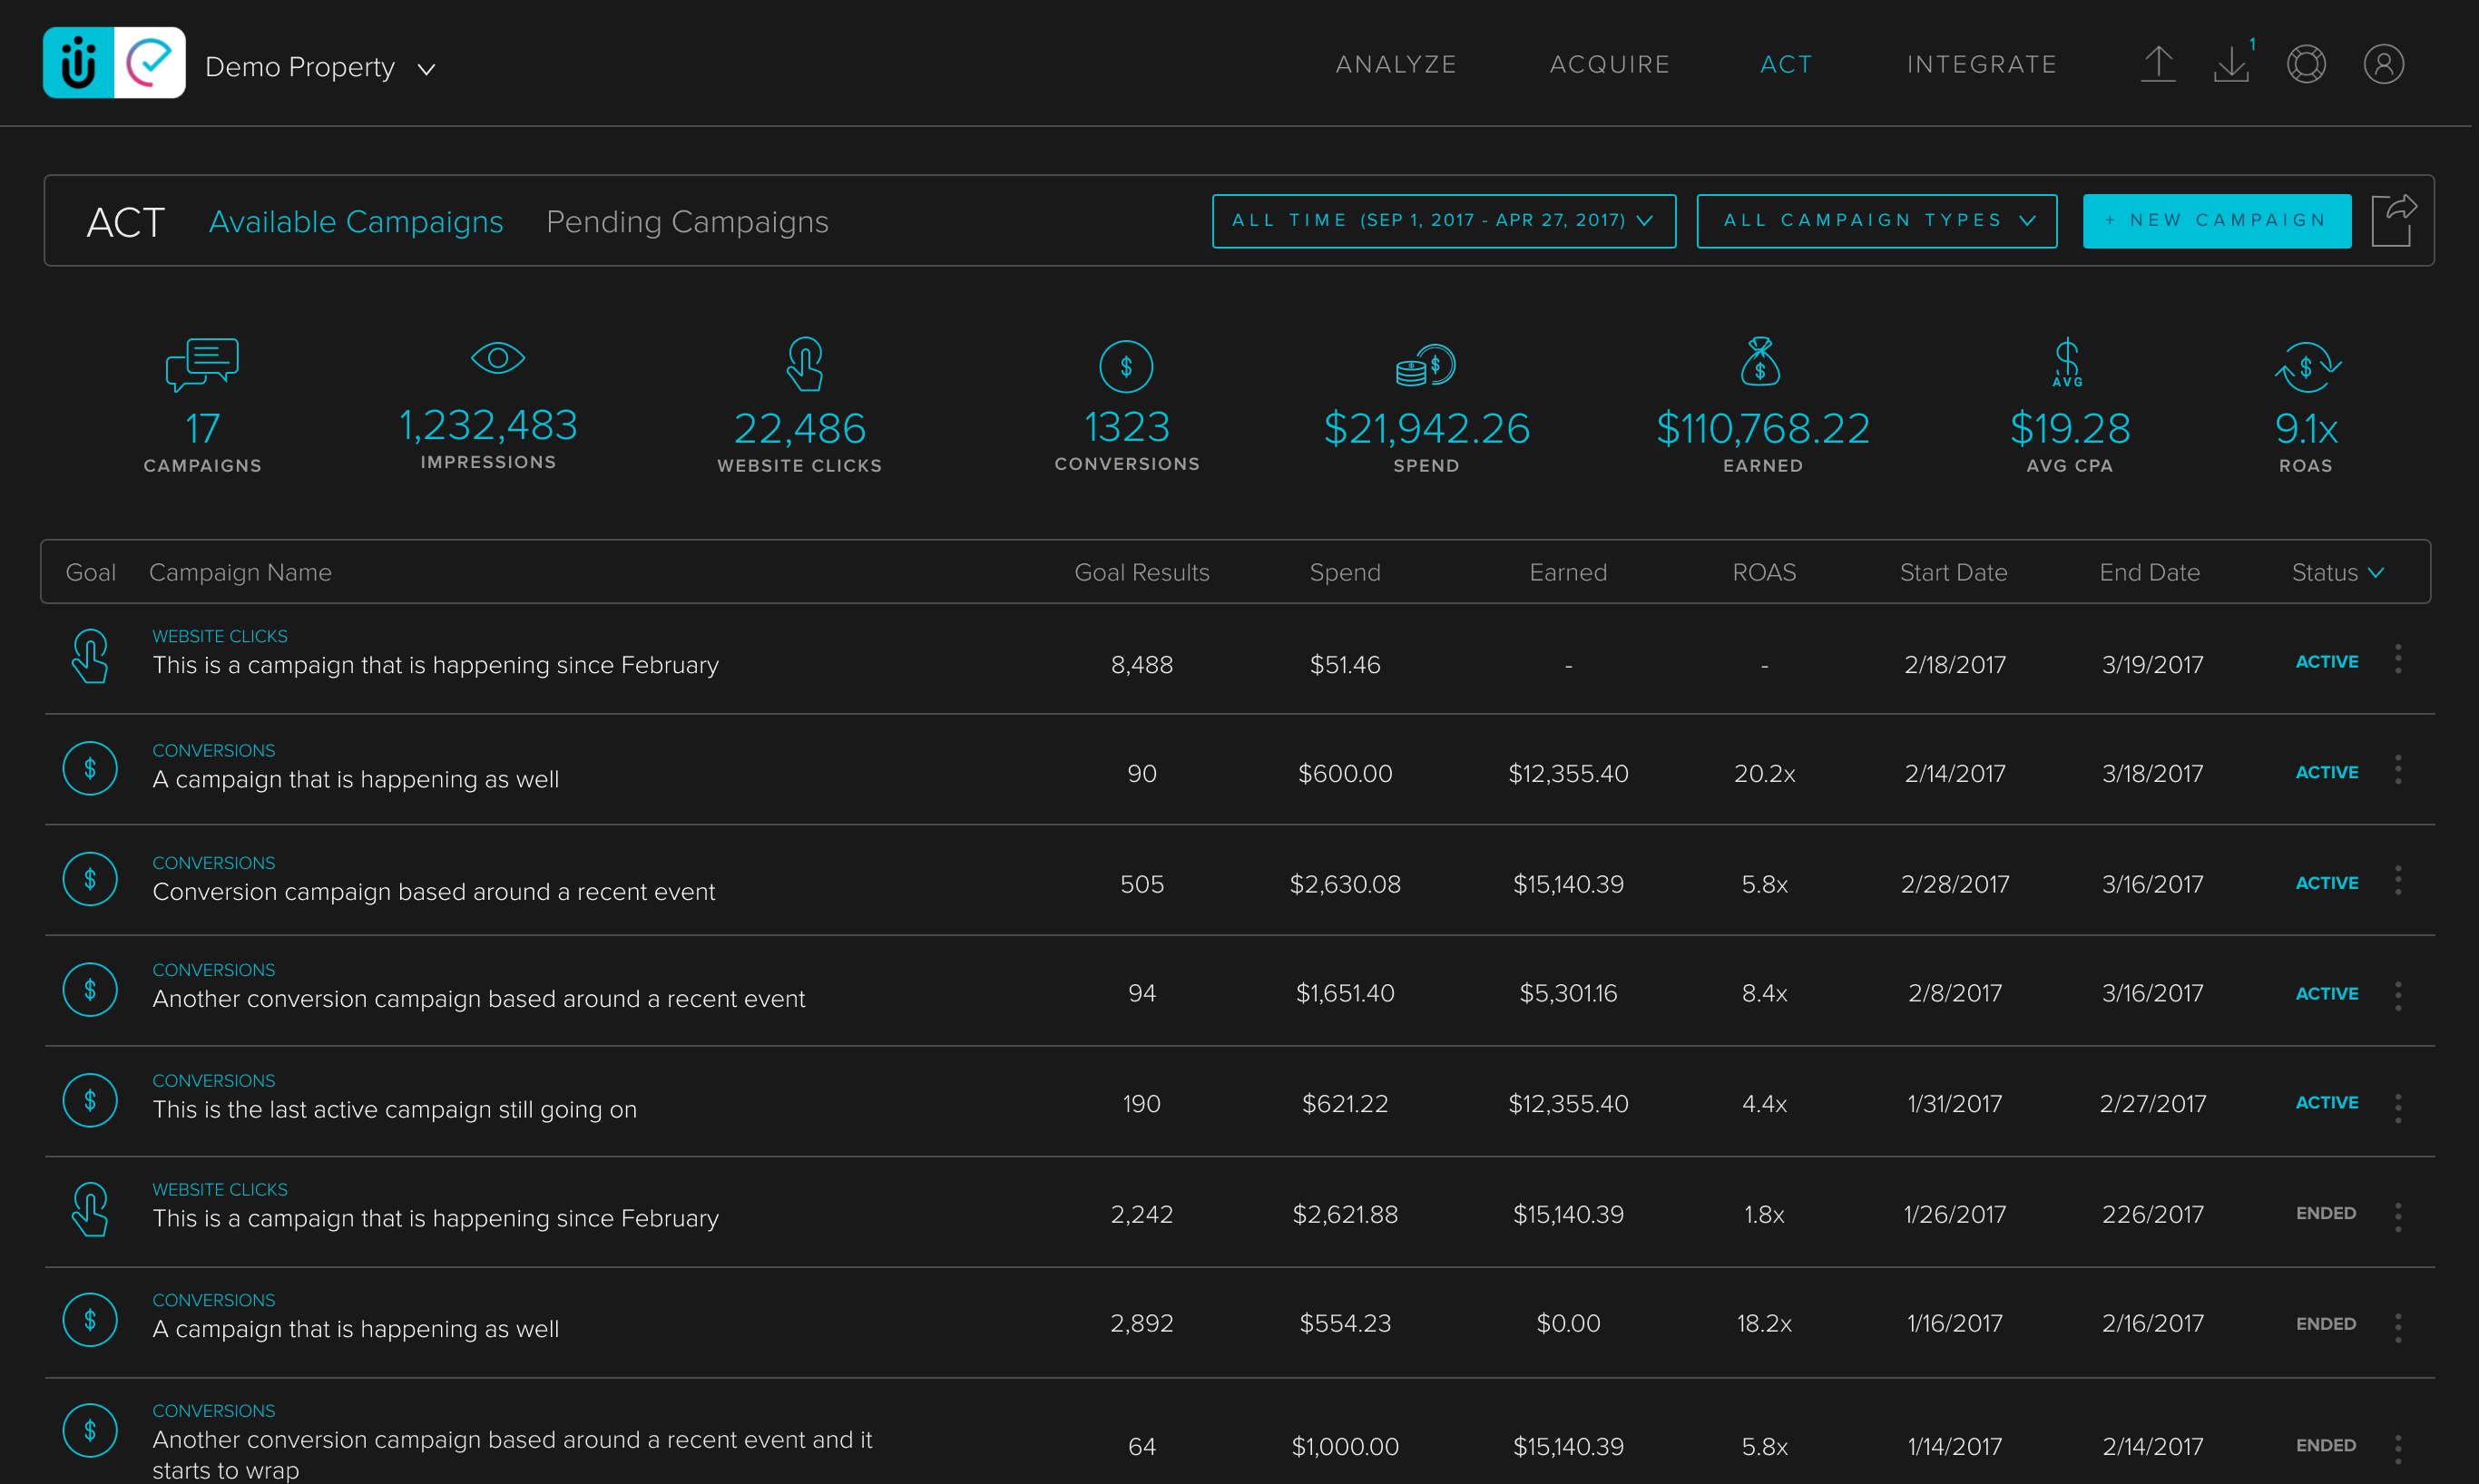
ACT PAGE (Facebook Ad Campaigns)
- Page views went up from around 900/month to about 1,250/month
- Visitors went up from about 65/month to about 85/month
ACQUIRE PAGE (Engagements)
- Page views tripled from 1,250/month to 4,750/month
- Visitors went up from about 100/month to about 125/month to that page.
- About twice as many engagements are created per month than the average month.
SCREENS